
Website analytics is the collection and analysis of data about how people find and use a website: how many visit, where they come from, which pages they read and whether they take the actions that matter to the business, such as sending an enquiry, booking or buying. Google Analytics 4 (GA4) is Google’s free tool for this.
What website analytics tells you
- Where visitors come from. Search engines, pay-per-click ads, social media, email, links from other websites, or typing your address directly. Our article on sources of traffic explains each channel.
- Which pages they land on and read. The first page of each visit, often a landing page or a blog post, says a lot about what brought people in.
- How engaged they are. How long they stay, how far they scroll and whether they move on to a second page.
- Whether they act. Form submissions, phone number clicks, bookings, purchases.
- Who they are, in broad terms. Device, browser, country and city, never their names.
The real value is in combining these. Knowing that a page had 2,000 visits says little. Knowing that visitors from Google Ads read the pricing page and leave, while visitors from organic search read the same page and phone, tells you where to look.
How GA4 records what visitors do
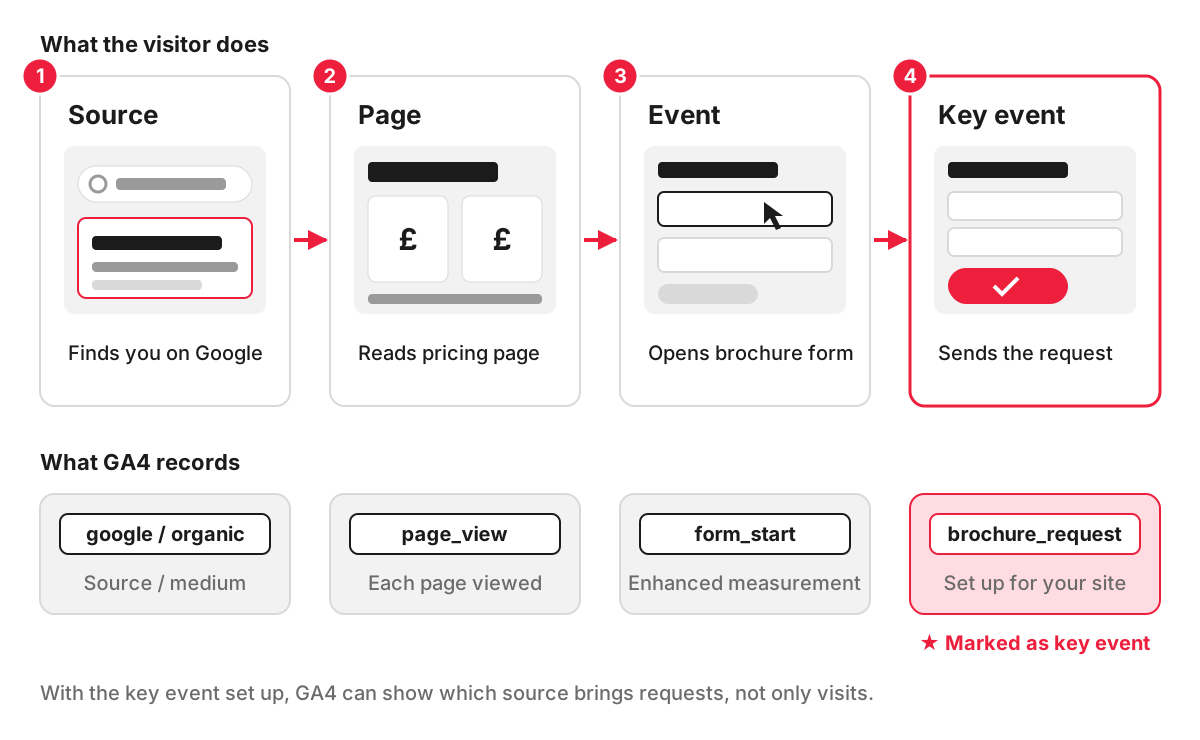
GA4 measures events: each page view, click or form submission is recorded as an event with details attached. Some events are collected automatically as soon as the tracking code is installed. Others come from enhanced measurement, a setting that records page views, scrolls to the bottom of a page (when 90% of its height has been seen), clicks to other websites, site searches, video engagement, file downloads and form interactions without extra code.
Everything specific to your business has to be set up: a “request a quote” form, a click on the phone number, a completed booking in a third-party system. You then mark the most important of these as key events, GA4’s name for actions that matter to the success of the business. They were previously called conversions in Analytics; in Google Ads, “conversion” now means an action used to measure and optimise ad campaigns.
This set-up is often done in Google Tag Manager, a separate tool that manages tracking code without editing the website for every change.
A worked example
A wedding venue in the Cotswolds advertises on Instagram and Google and also gets visitors from organic search. With only the basic tracking code installed, GA4 shows visits by channel and the most-read pages, and nothing about brochure requests, which happen through a form on the site.
Once the brochure form is set up as a key event, the picture changes. Instagram visitors look through the photo gallery but rarely ask for a brochure. Visitors who searched for barn wedding venues read the pricing page and request one. The venue keeps Instagram for awareness, moves part of the budget to search ads and adds a brochure button to the gallery page, then checks the numbers again a month later. That is the cycle analytics supports: measure, change one thing, measure again, which is also the basis of A/B testing.
Analytics, Search Console and heatmaps
Each tool sees a different part of the journey:
- Google Search Console shows what happens before the click: which searches your site appears for, its average position and how often people click. It covers organic Google search only.
- Google Analytics shows what happens after the click, for all channels.
- Heatmaps and session recordings, from tools such as Microsoft Clarity or Hotjar, show where people click, how far they scroll and where they hesitate on a page. They explain the “why” behind a number in GA4 and are a standard part of conversion rate optimisation.
- Your CRM or booking system shows what happens after the enquiry: which leads became customers.
Cookies and consent in the UK
Analytics tools usually store cookies or similar data on visitors’ devices, which is regulated by PECR in the UK. The ICO’s guidance on storage and access technologies sets out a “statistical purposes” exception: consent is not needed when the only purpose is aggregate statistics used to improve your site, you give clear information about it and you offer a simple, free way to object. A third-party provider has to act as your processor and use the data only to help you improve your service. Tracking or profiling individuals and advertising uses still need consent, so a GA4 set-up linked to advertising features needs particular care.
Google’s consent mode passes each visitor’s choice to Google’s tags, which then adjust how they collect data. This section is a summary, not legal advice; check your own set-up against the ICO guidance.
Common analytics mistakes
- Tracking only page views, with no key events, so nobody can say which channel brings enquiries.
- The tracking code missing from some templates, such as the checkout or a booking page, or installed twice, which doubles the numbers.
- Visits from staff and the agency counted as customer visits.
- A cookie banner that blocks tracking until consent and is never tested, so data quietly stops arriving.
- The GA4 property owned by whoever set it up. If a former agency or freelancer holds the only admin access, the business can lose years of data. The account should belong to the business, with others added as users.
How we set up analytics
Every website we build has Google Analytics 4 connected as part of the price. Detailed event tracking in Google Tag Manager, such as forms, calls and purchases recorded as key events, is available as an extra. As with the rest of our website development work, you own the code, content and accounts, and we provide documentation.
FAQ
How do I get analytics on my website?
Google’s set-up guide has four steps: create an Analytics account, create a property, add a web data stream for your site’s address, and add the Google tag. Many website builders and WordPress plugins only need the Measurement ID starting with “G-” pasted into a settings field. On a hand-coded site, the tag goes into the head section of every page.
What are the main web analytics tools?
Google Analytics 4 covers most needs for a small or medium business. Matomo, which can run on your own server, and Plausible, which collects less data, are common alternatives. Microsoft Clarity and Hotjar add heatmaps and session recordings, and Google Search Console adds data about organic search. Most businesses use two or three of these together.
Should I use Google Analytics for my website?
For most business websites, yes: it is free, widely understood and connects to Google Ads and Search Console. The case for an alternative is stronger if you want a simpler interface, prefer to keep visitor data outside Google, or have very little traffic and only need the basics. Whichever tool you choose, it is only useful once your key events are set up.
How long does GA4 keep data?
Standard reports keep aggregated data. The data retention setting applies to user-level and event-level data in explorations and funnel reports, and for a standard property it can be set to 2 or 14 months. If you want to compare this year’s behaviour with last year’s in explorations, 14 months is the setting to choose.